SustainabilitySUSTAINABILITY
-
Medium- to Long-Term Sustainability
You can see Medium- to Long-Term Sustainability Management Plan announced November 25, 2021.
Management Plan -
Basic CSR Policy and Code of Conduct
You can see Basic CSR Policy and Code of Conduct. -
Social contribution activities
You can see Community Contribution Activities and Initiatives to promote sports , etc. -
Environment
You can see environmental policy, TCFD, GHG emissions (Scope 1, 2, 3 calculations and reduction targets), Initiatives to reduce environmental burden and biodiversity. -
Social
You can see human resource management, diversity, and efforts regarding health management. -
Governance
You can see basic aproach, systems and Initiatives of corporate gavernance.
in Charge of Sustainability
Sustainability Information
- Briefing Materials, Reports
-
Sustainability Briefing Material
- Sustainability Briefing Material
 (2,017KB)
- Sustainability Briefing Material
- Events
-
FY2024/3▼ OPEN
The second Biotope Lecture Session Held for Employees
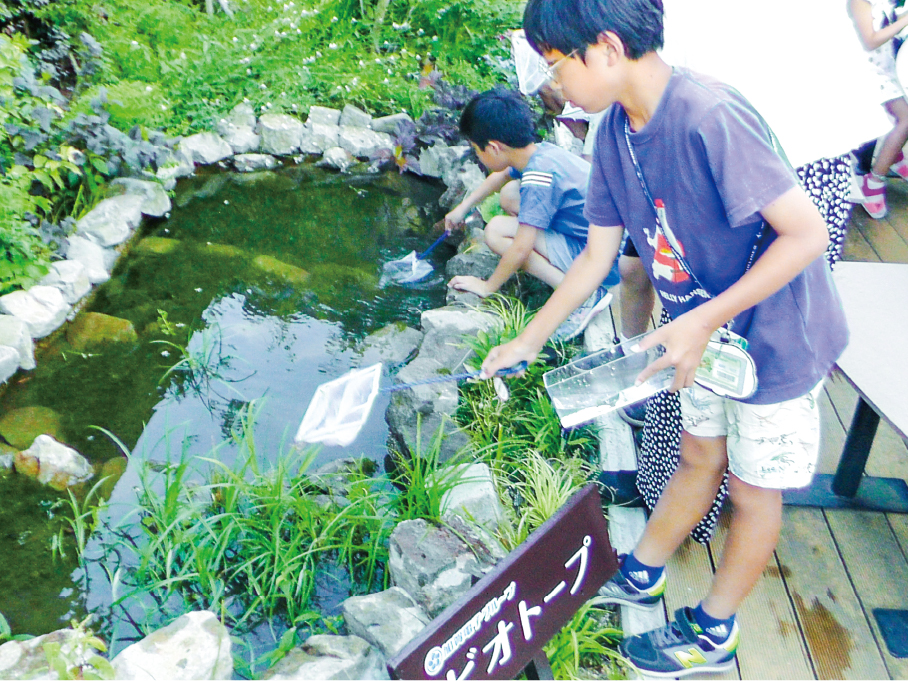
at Biotope Installed on Roof of Head Office(July 27, 2024)The Kaga Electronics Group installed a biotope on the roof of the Kaga Electronics head office building (Chiyoda-ku, Tokyo) in July 2023 as a concrete action to address environmental issues such as reducing greenhouse gases. By providing a habitat and growing space for wildlife in an urban center where there are few natural environments and serving as a hub in the biotope network, the biotope is contributing to the conservation of biodiversity. It also serves as a place where Group employees can learn about biodiversity conservation and the protection of the natural environment, enjoy nature, and feel connected to living things.
A biotope was installed in July 2023 to provide a habitat and growing space for wildlife and to contribute to the conservation of biodiversity. Plants designated as endangered species bloom inside the biotope, making it a place where employees can learn about biodiversity conservation and the protection of the natural environment and feel connected to living things while enjoying nature.
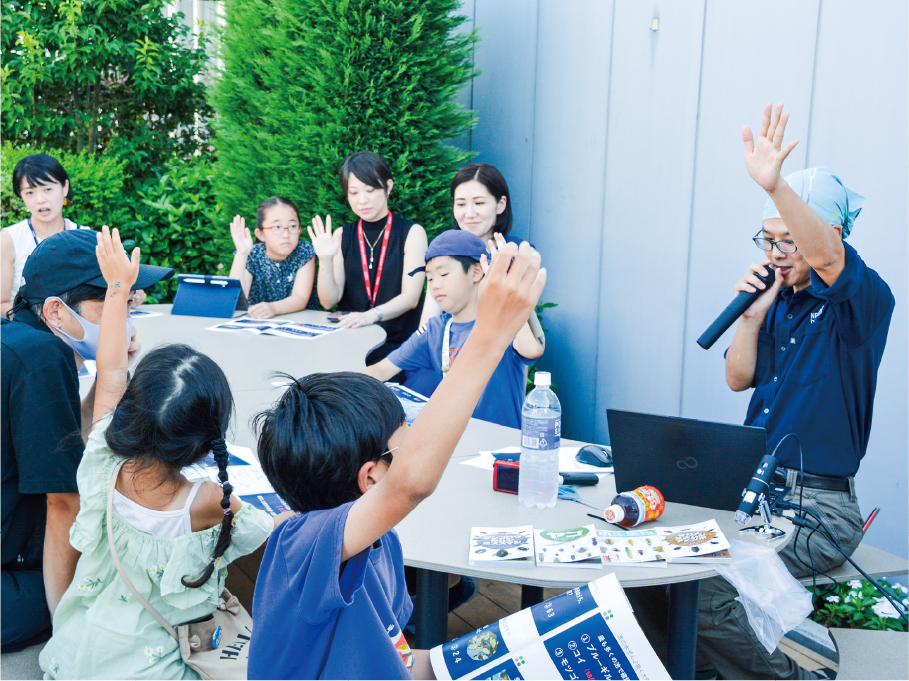
Kaga Electronics also holds biodiversity-themed lecture sessions for children. External experts(NPO「birth」 Mr. Junichi Kubota) are invited to these lecture sessions, providing employees and their families with opportunities to learn about biodiversity while enjoying interacting with nature.
Kaga Electronics will work to raise employees’ awareness of nature and the environment through these kinds of opportunities.
*Biotope: an area that provides a living place for local wildlife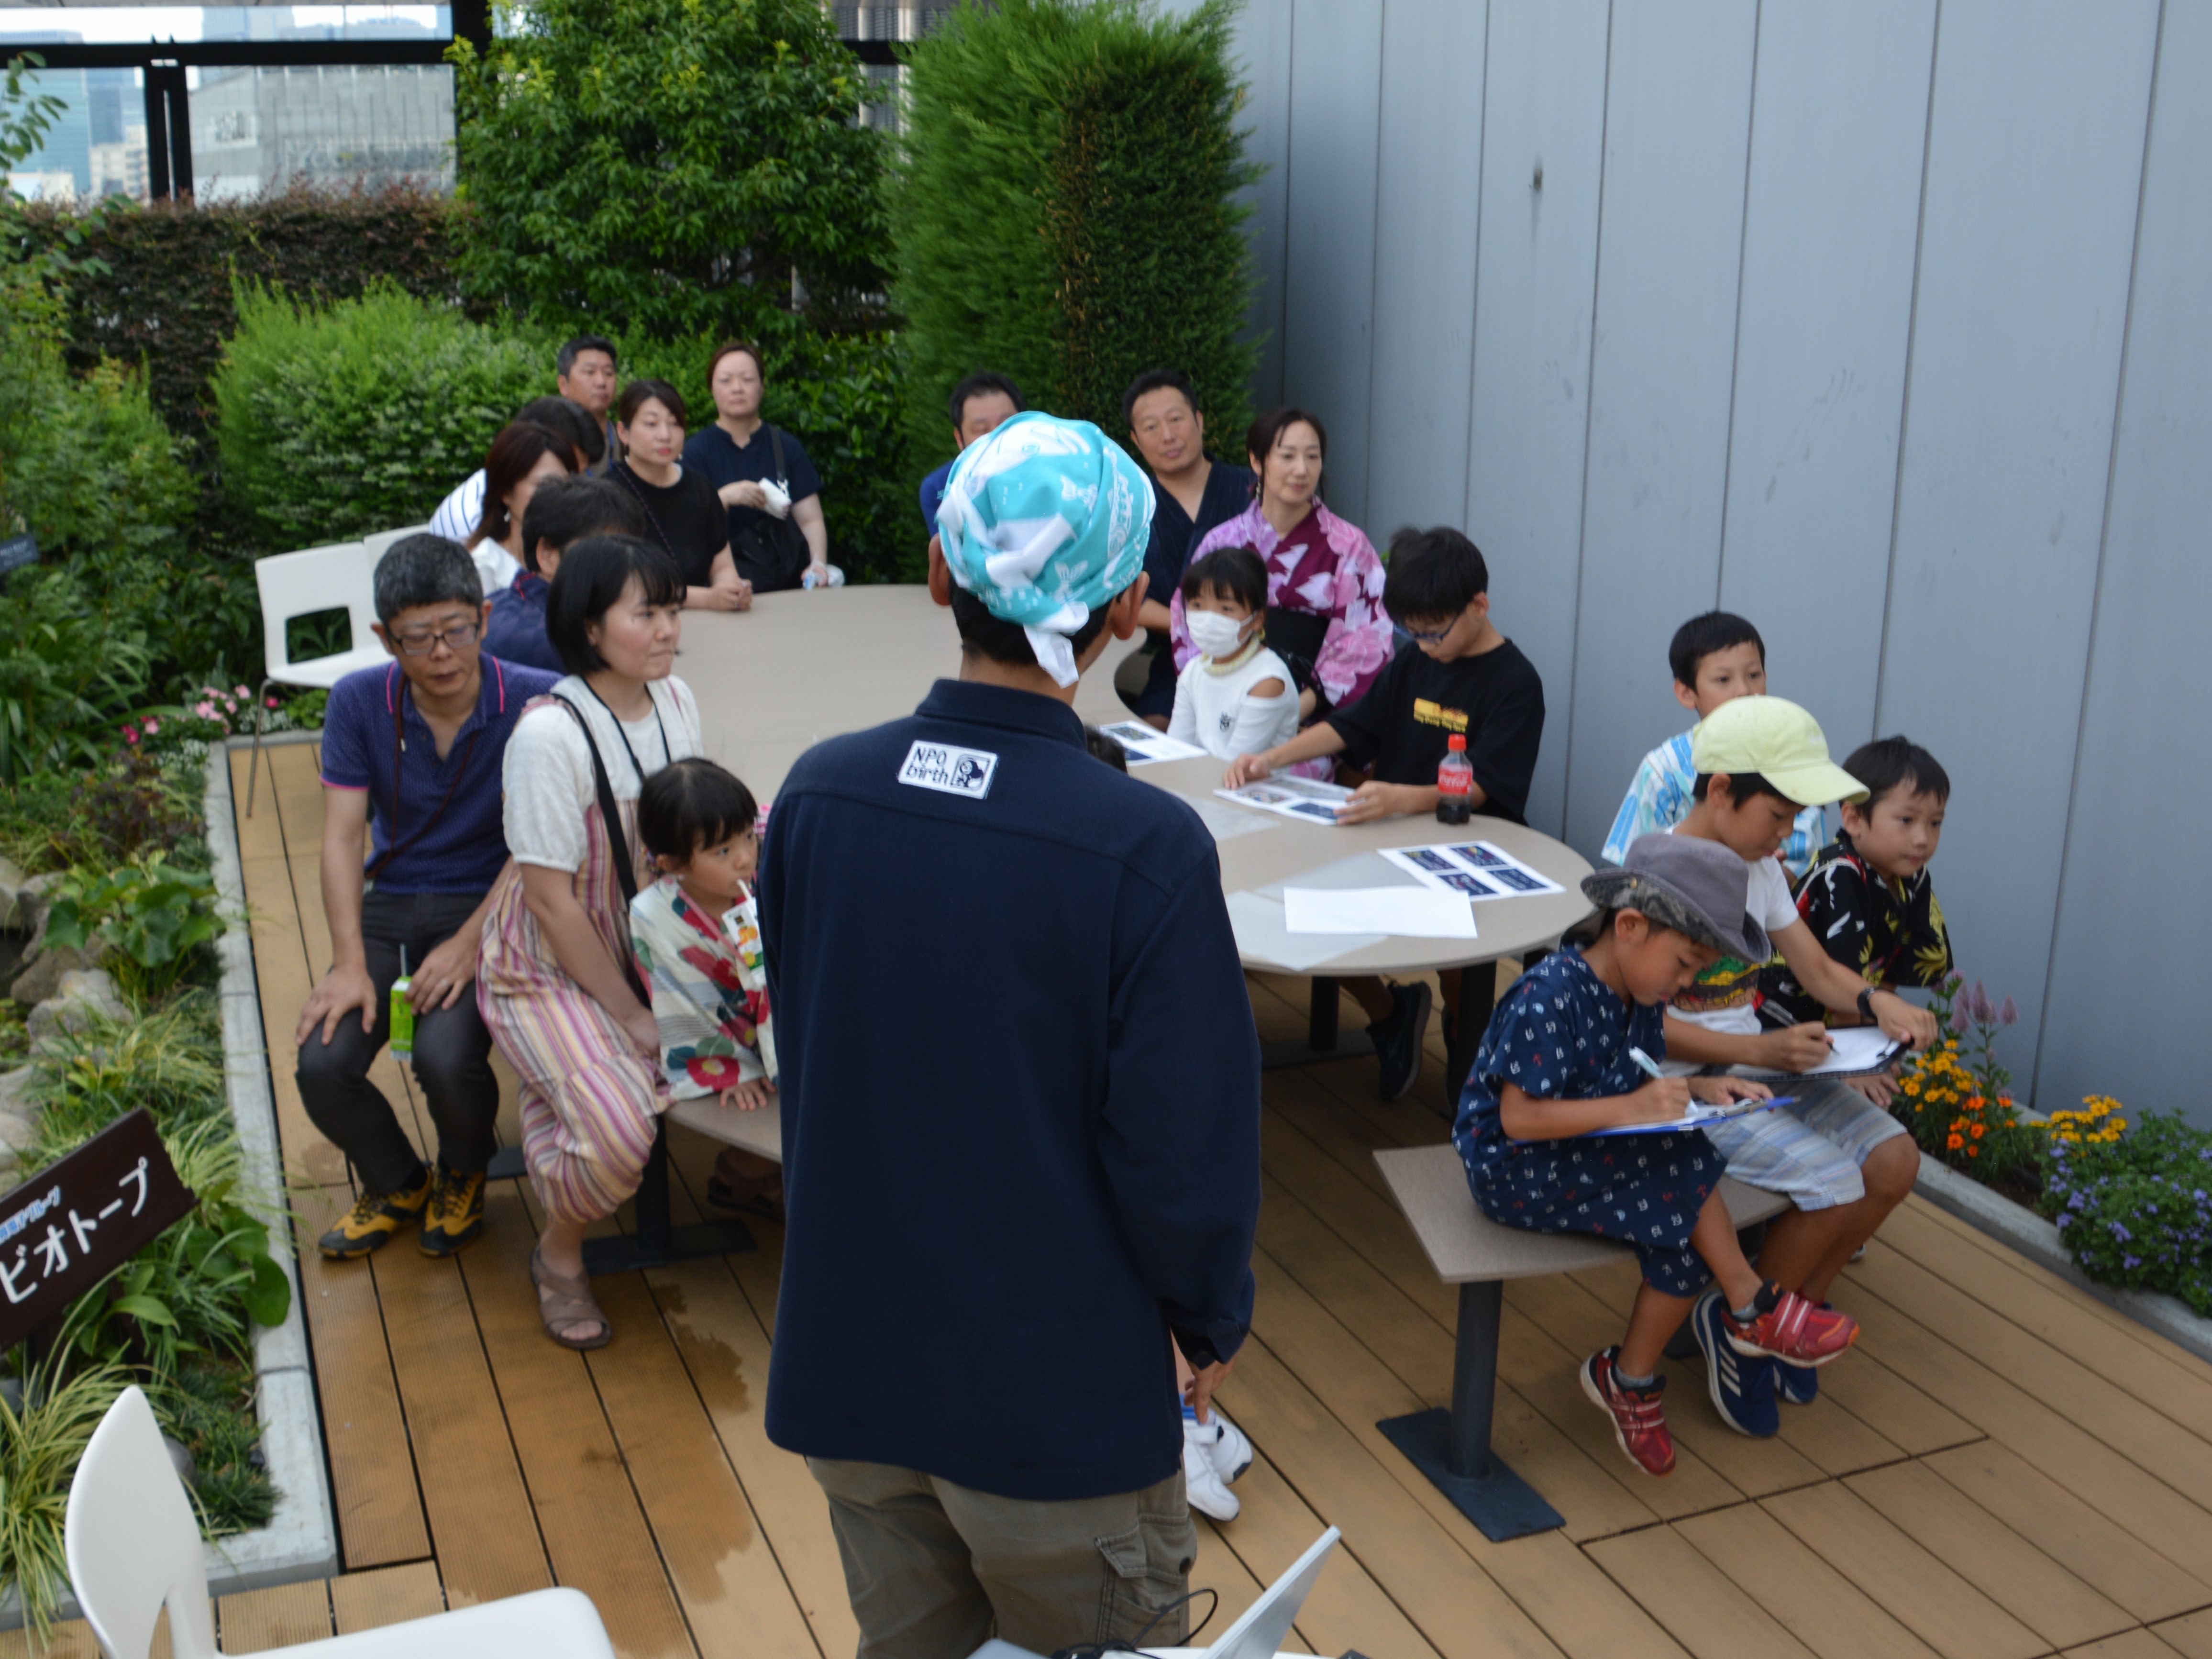 Scenes from the lecture
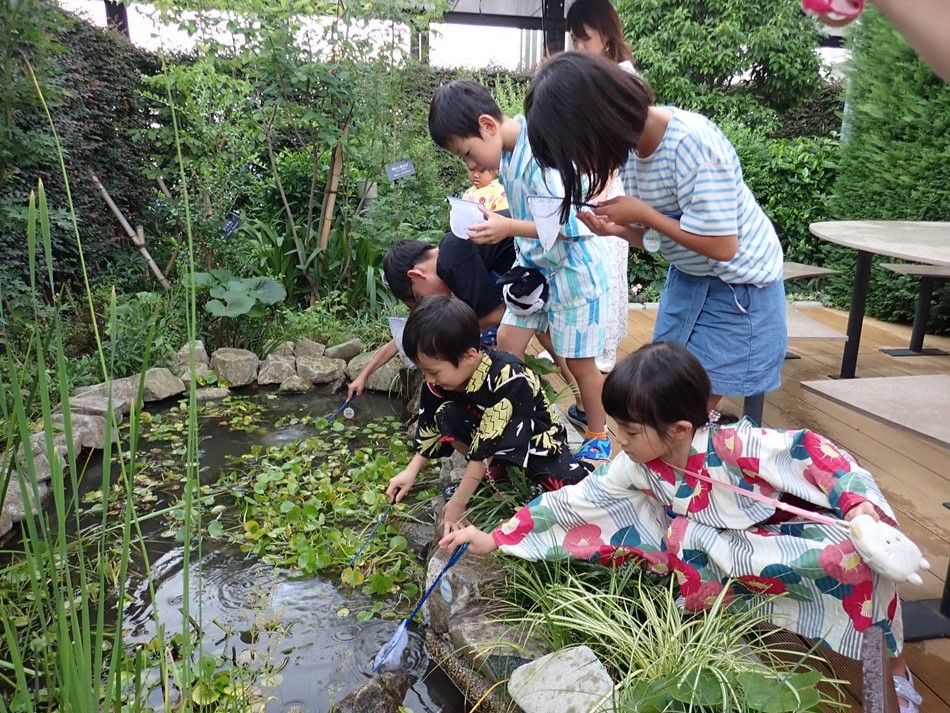 Collecting organisms in the biotope
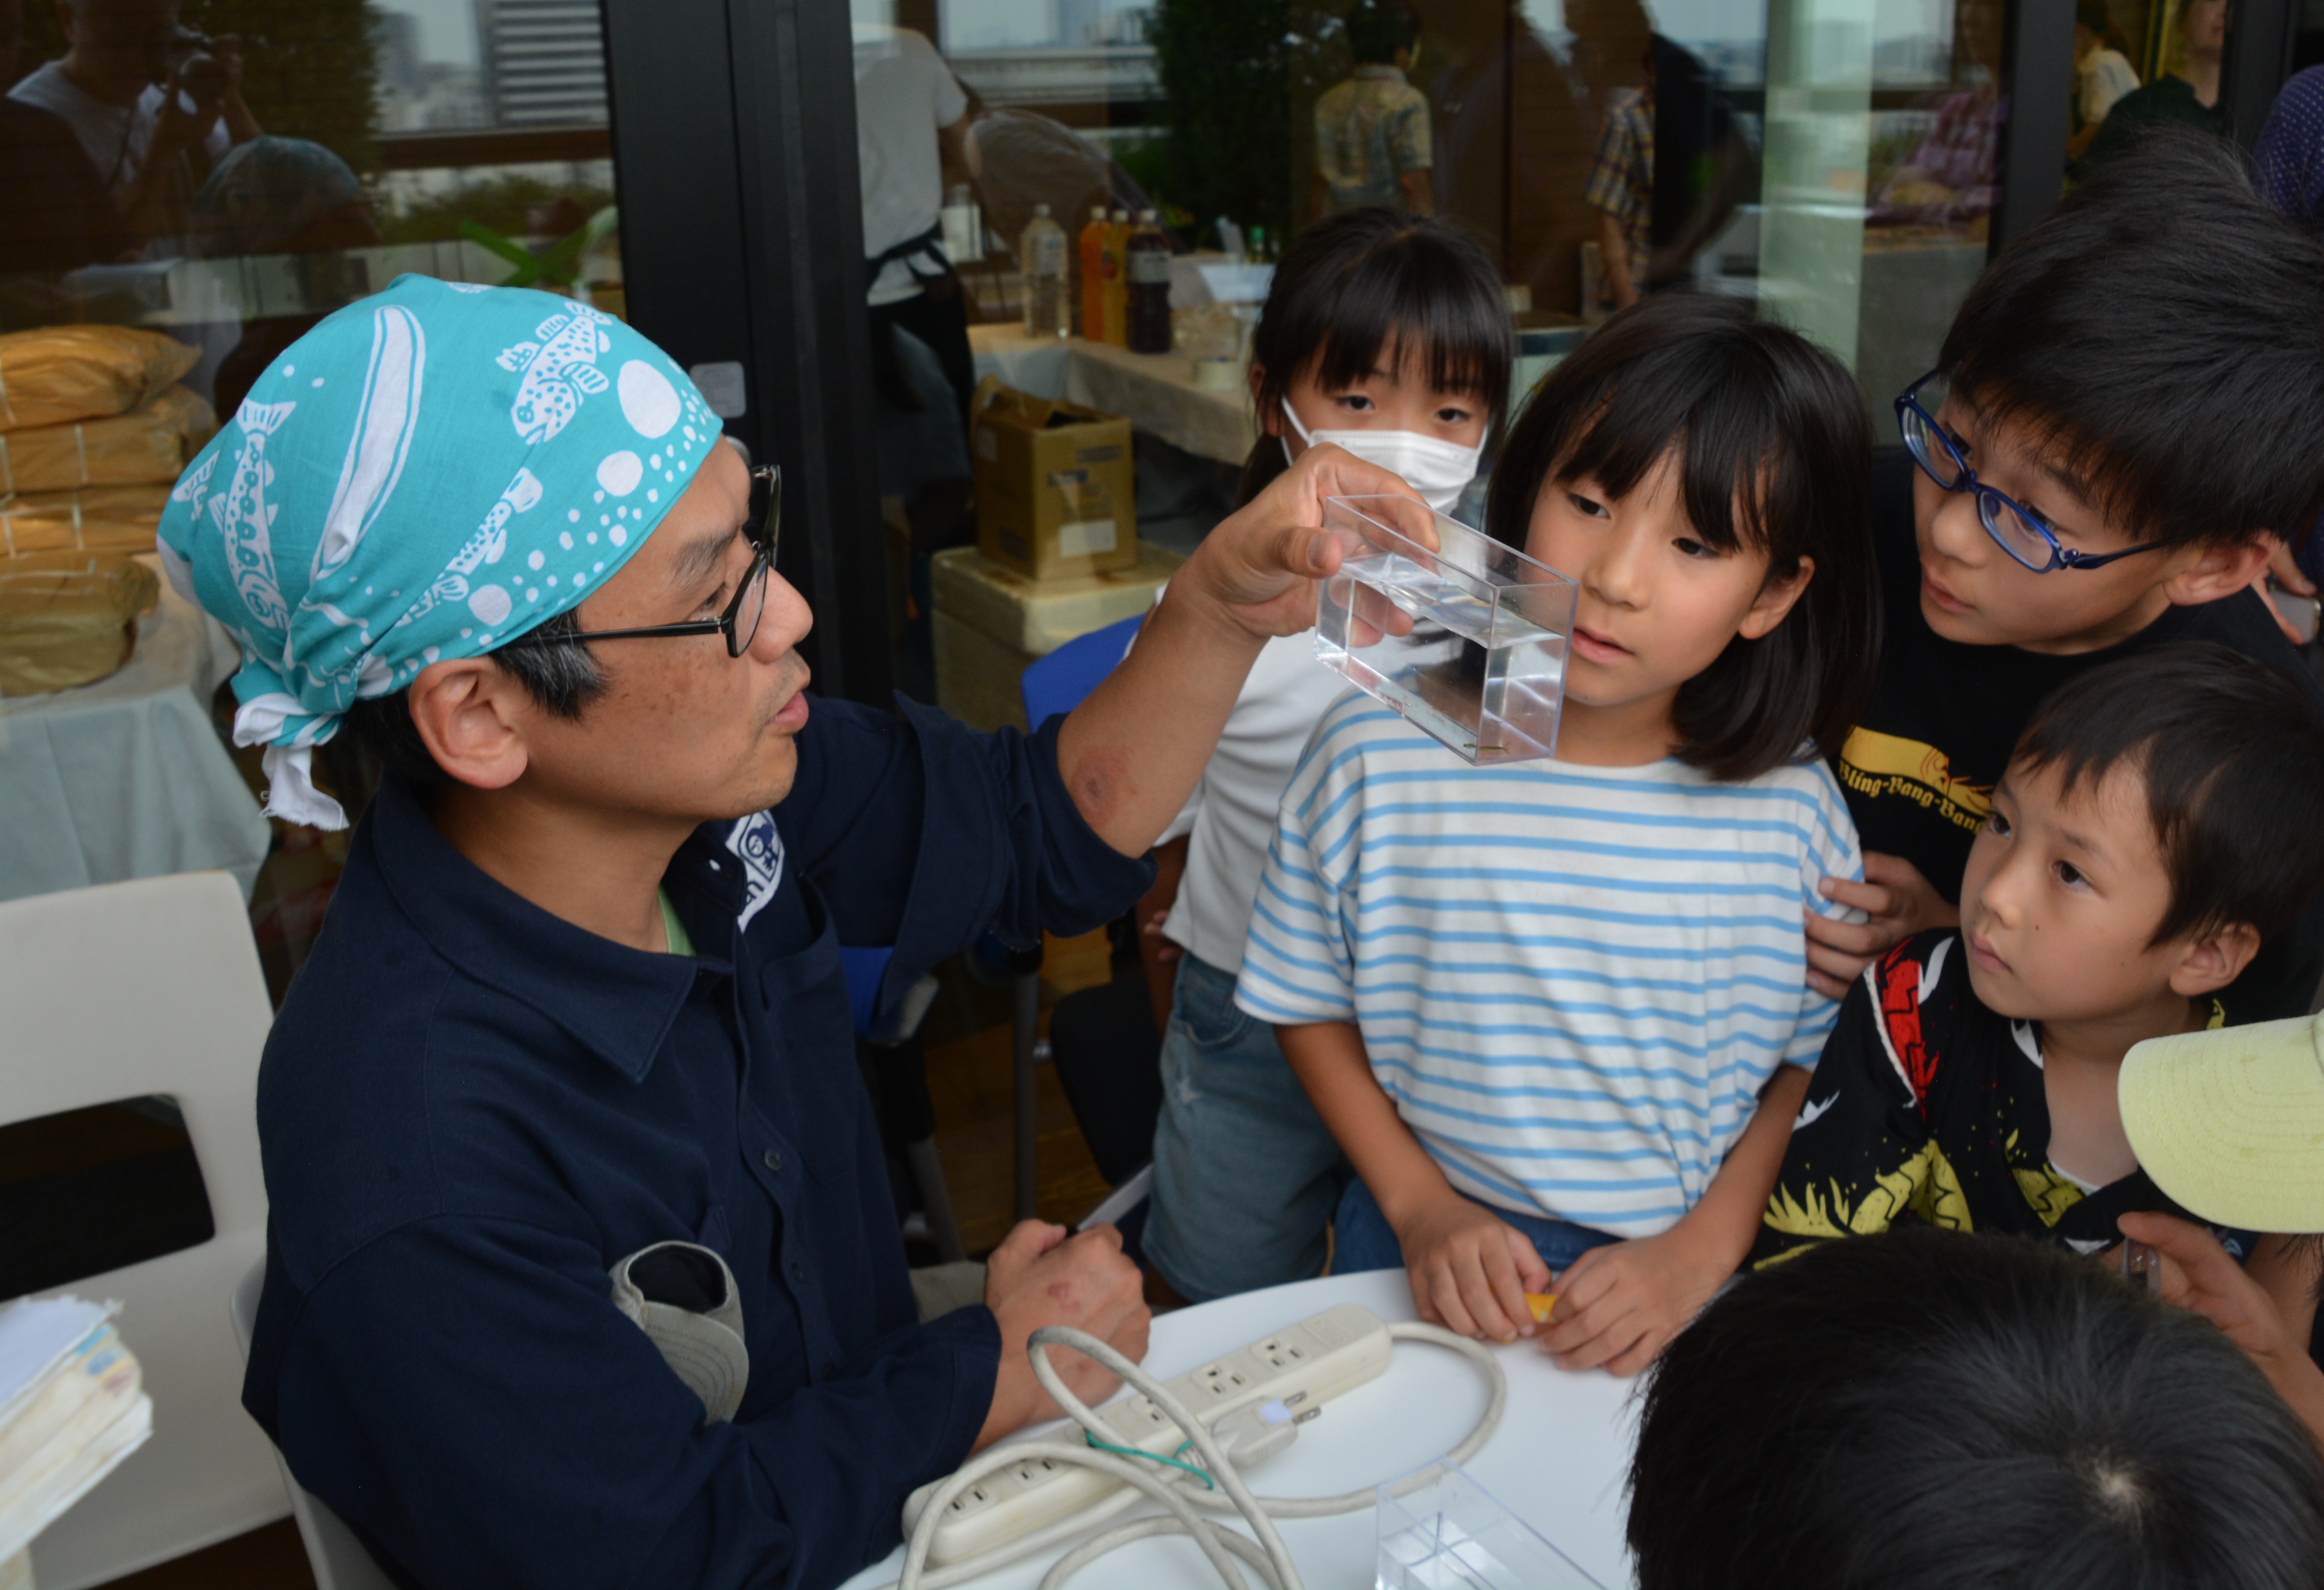 Very interested
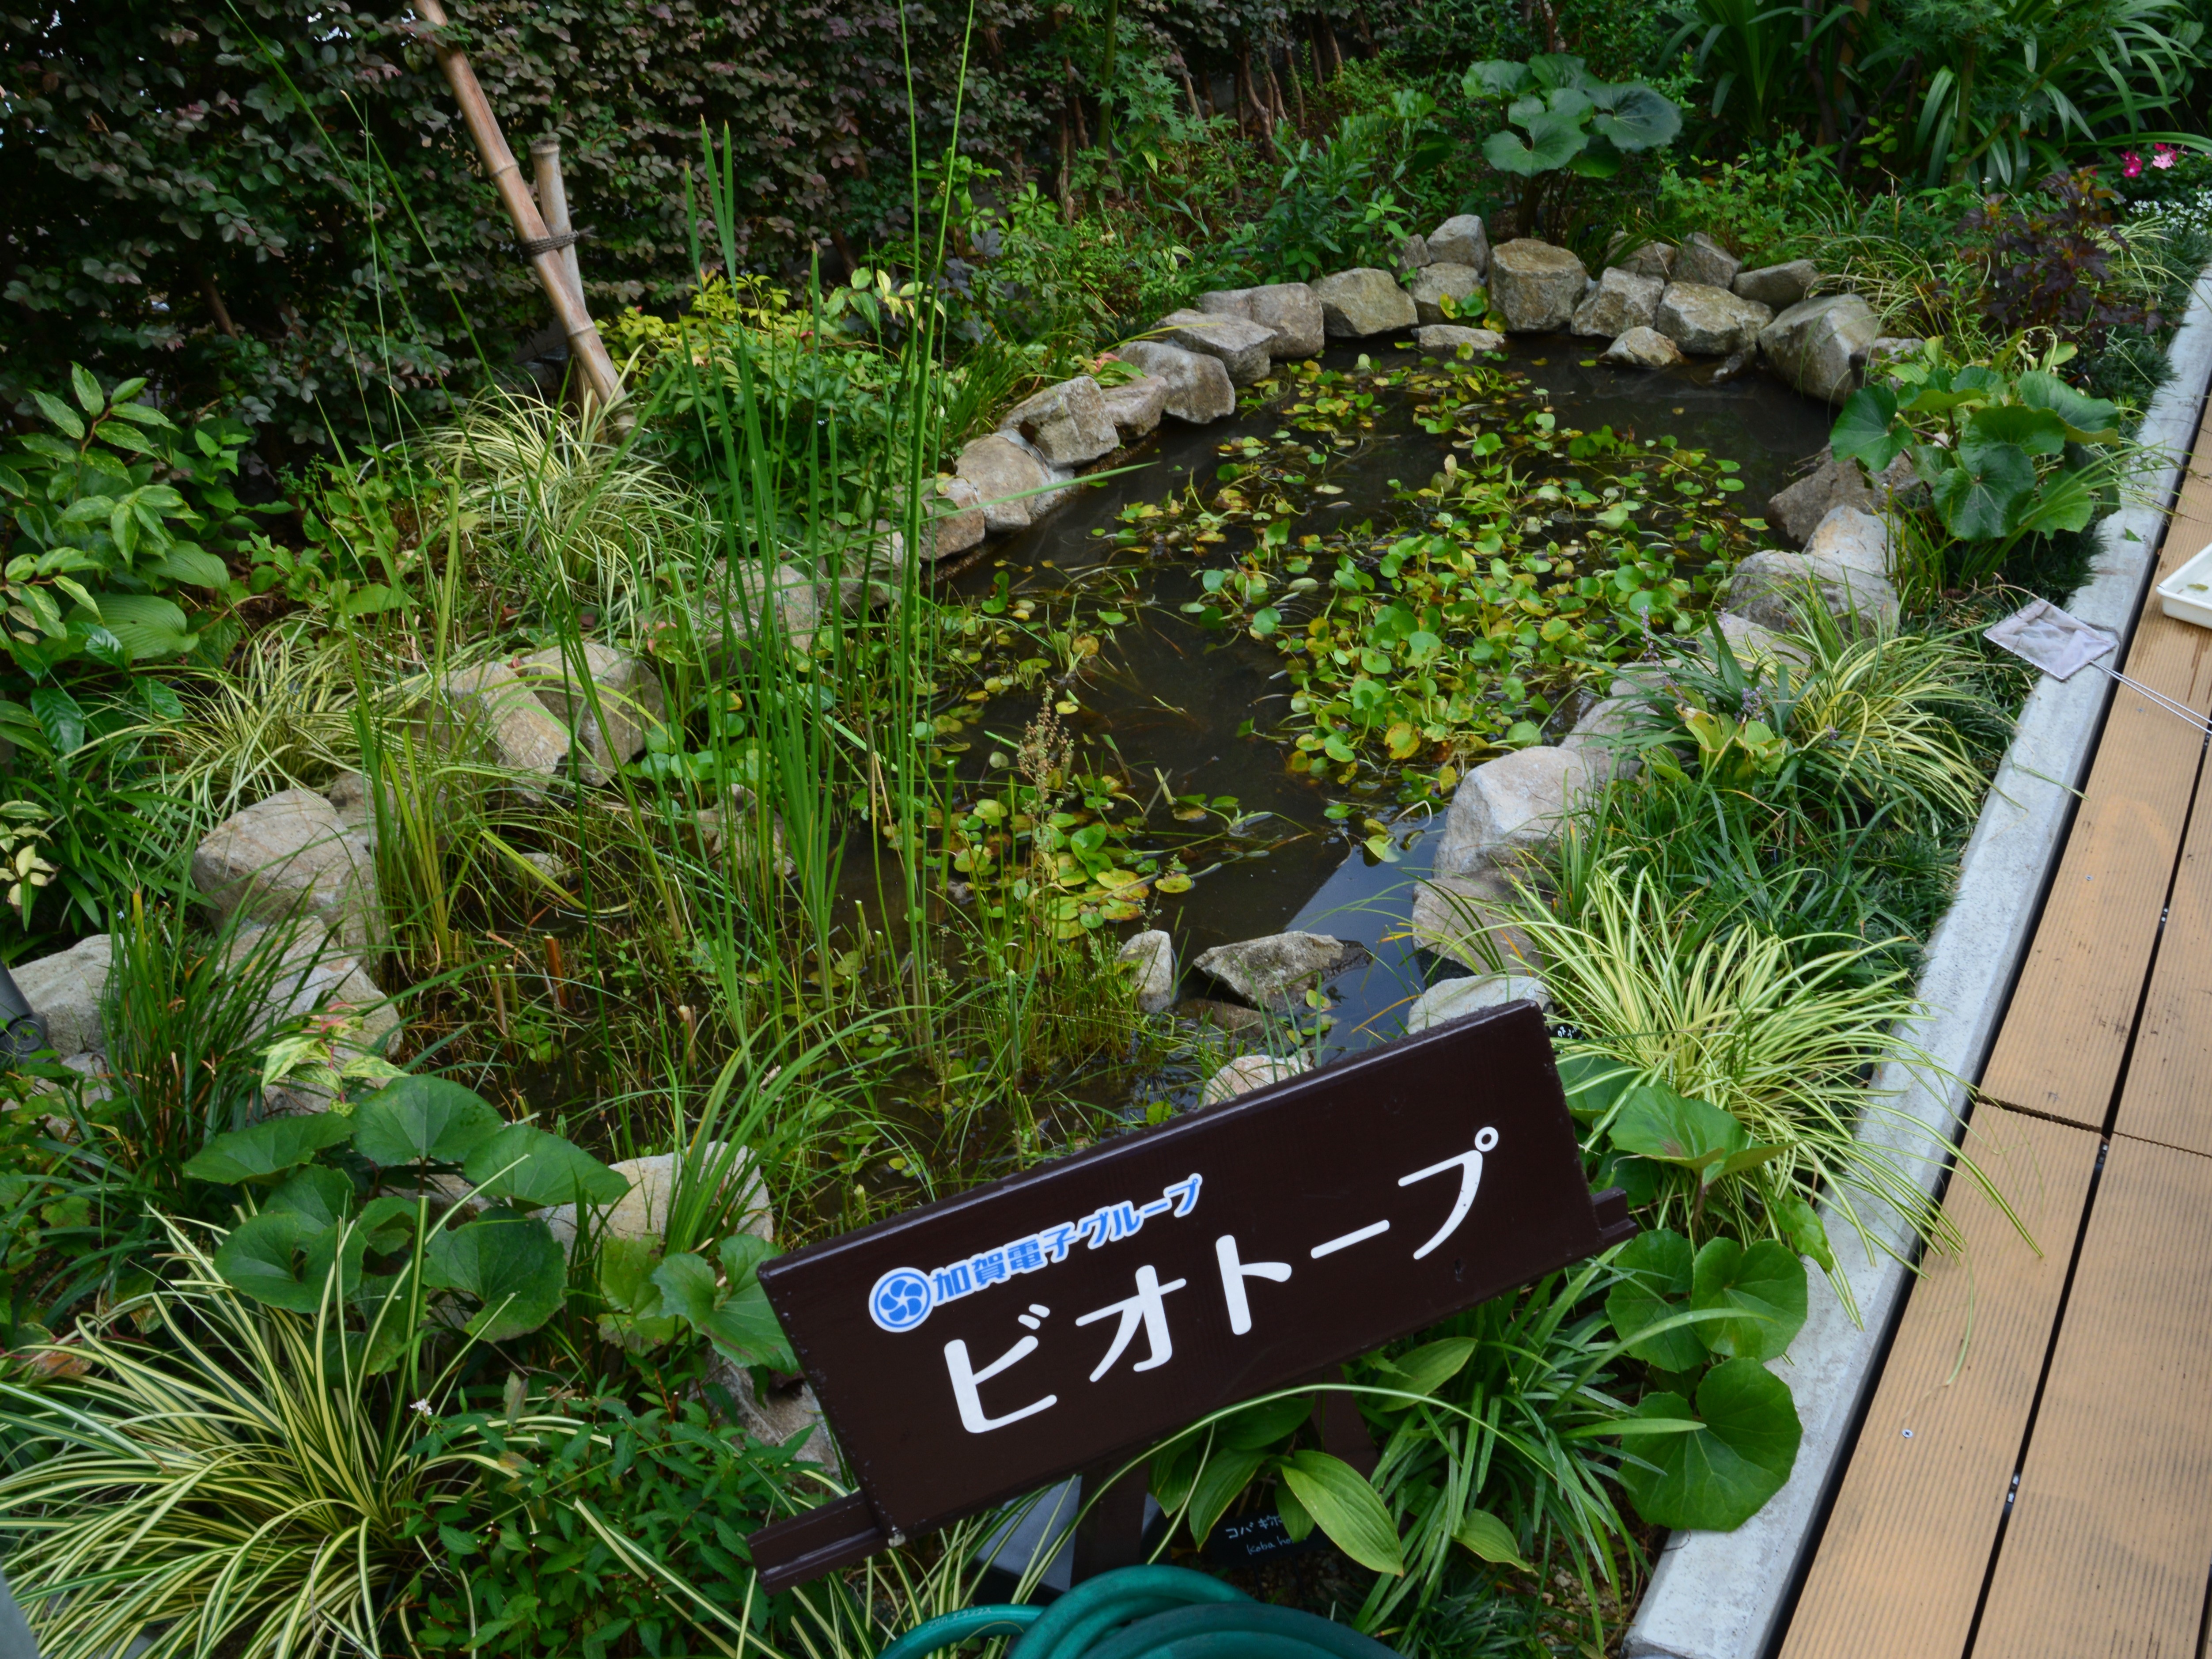 The biotope on the day of the lectureFY2023/3▼ OPEN
Biotope Lecture Session Held for Employees
at Biotope Installed on Roof of Head Office (July 29, 2023)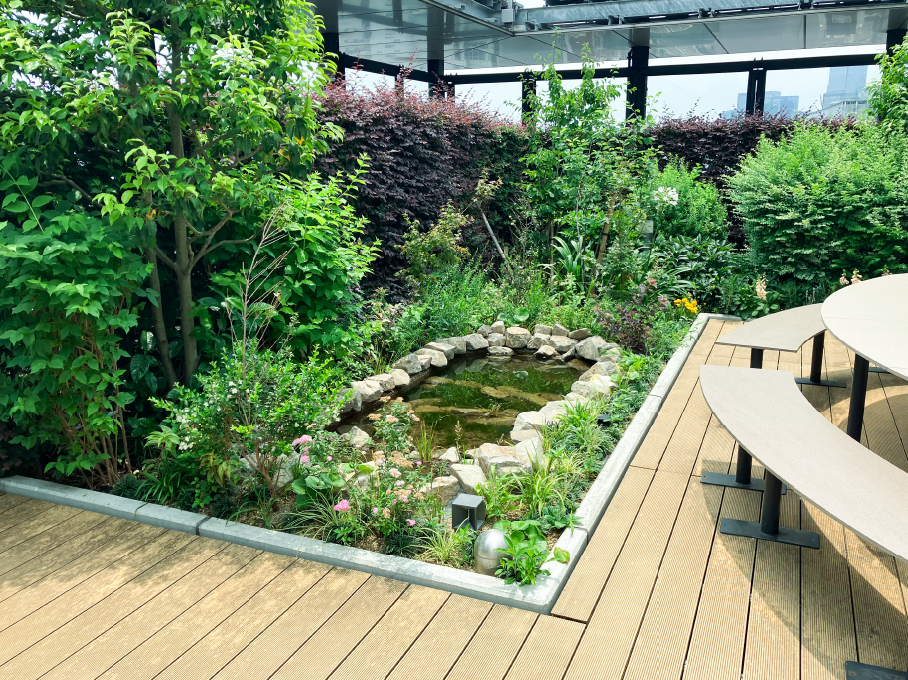
The Kaga Electronics Group has installed a biotope on the roof of the Kaga Electronics head office building as a concrete action to address environmental issues such as the reduction of greenhouse gas emissions. This initiative considers the conservation of biodiversity and the protection of the natural environment through the cultivation of plants and other organisms. It also creates an environment that facilitates species preservation and provides a friendly habitat for organisms.
In addition to installing the biotope, the Group invited an outside expert to hold a lecture session on biodiversity on July 29, 2023, aimed at promoting the conservation of biodiversity and the protection of the natural environment, as well as encouraging participants to enjoy nature and feel a connection to other living things. Employees took part in the session along with their families, including their children, providing them with an opportunity to have fun interacting with nature.
Kaga Electronics will work to raise employees’ awareness of nature and the environment through these kinds of opportunities.
*Biotope: an area that provides a living place for local wildlife
- ESG Data
-
Environment
Greenhouse gas emissions2018/3 2019/3 2020/3 2021/3 2022/3 2023/3 2024/3 2025/3 Scope1(tCO2e) - - - - - - 1,215 1,078 Scope2(tCO2e)
※1,2289 281 256 227 252 310 28,470 29,392 Scope3(tCO2e)
Category1
Purchased goods and services- - - - - - 1,661,322 1,680,038 Category2
Capital goods- - - - - - 12,092 12,711 Category3
Fuel- and energy-related activities(not included in scope 1 or scope 2)- - - - - - 3,284 3,452 Category4
Upstream transportation and distribution- - - - - - 38,920 43,931 Category5
Waste generated in operations- - - - - - 3,581 1,654 Category6
Business travel- - - - - - 754 665 Category7
Employee commuting- - - - - - 2,303 2,635 Category11
Use of sold products- - - - - - 20,384 18,018 Category12
End-of-life treatment of sold products- - - - - - 20.7 16.7 Total Scope1+2 - - - - - - 29,685 30,470 CO2 emission per unit※3
(tCO2e/million yen)- - - - - - 0.0547 0.0556 ※1 Market based method
※2 Until 2023/3, calculation was made only for the Kaga Electronics Head Office building.
※3 The CO2 emission is divided by consolidated net sales (unit: millions of yen).Energy consumption2018/3 2019/3 2020/3 2021/3 2022/3 2023/3 2024/3 2025/3 Scope1
【Gasoline(L)】- - - - - - 213,444 188,403 【Light oil(L)】 - - - - - - 128,679 110,555 【Kerosene(L)】 - - - - - - 119,787 103,258 Scope2※1
【Electric power(kWh)】764,780 744,417 677,957 601,660 667,097 821,130 43,949,150 46,912,439 Solar Power Generation Volume
(kWh)※1- - - - - 1,157,565 1,698,137 2,439,372 Renewable Energy
【Electricity Consumption(kWh)】- - - - - 1,427,744 2,172,463 3,597,927 Renewable Energy Adoption Rate - - - - - - 4.94% 10.89% Energy usage per unit※2
(kWh/million yen)- - - - - - 100.2 106.1 ※1 Until 2023/3, calculation was made only for the Kaga Electronics Head Office building.
※2 The energy usage is divided by consolidated net sales (unit: millions of yen).Resources(Water Resources,Paper Usage)2018/3/1 Mar-19 Mar-20 Mar-21 Mar-22 Mar-23 Mar-24 Mar-25 Water Resource Consumption(Kℓ)※1 - - - - - 23,117 26,968 20,950 Discharge volume(Kℓ)※1 - - - - - 23,117 26,968 20,950 Copy Paper Usage(sheet)※2 - - - - - 2,145,125 2,135,914 2,014,798 ※1 Kaga Electronics Head Office building,Nagoya Office Building, Osaka Office Building, and Domestic Manufacturing Sites
※2 Kaga Electronics Head Office building, Hatchobori BuildingWasteMar-18 Mar-19 Mar-20 Mar-21 Mar-22 Mar-23 Mar-24 Mar-25 Office municipal waste (general waste from office activities)(t)※1 - - - - - 36.2 38.8 29 Amount of recycled waste (t) - - - - - 23.4 22.5 16.5 Recycling rate(%) - - - - - 64.8 58.0 57.0 Industrial Waste(t)※2 - - - - - - 4,442 3,151 Industrial Waste Generation and Recycling Volume(t) - - - - - - 152 1,441 Industrial Waste Generation and Recycling Rate(%) - - - - - - 3.4 45.7 ※1 Kaga Electronics Head Office building
※2 Companies subject to consolidation<Others>Mar-18 Mar-19 Mar-20 Mar-21 Mar-22 Mar-23 Mar-24 Mar-25 Environmental Conservation Costs
(thousand yen)- - - - - - 132,600 62,800 Emissions of Volatile Organic Compounds(t) - - - - - 0 0 0 Social
Employee Data(KAGA Electrocics Co.,Ltd.)2018/3 2019/3 2020/3 2021/3 2022/3 2023/3 2024/3 2025/3 Number of employees by gender
(Excluding temporary employees)
【Total】588 573 567 556 555 546 549 560 【Male】 412 392 382 374 374 364 360 355 【Female】 178 181 185 182 181 182 189 205 Consolidated number of employees by gender (Excluding temporary employees)
【Total】5,427 6,627 6,731 7,826 7,959 8,092 8,021 8,560 【Male】 3,000 3,498 3,527 4,150 3,874 3,823 3,928 4,235 【Female】 2,427 3,129 3,204 3,676 4,085 4,269 4,093 4,325 Average age of employees (Years old)
【Overall】41.4 41.8 42 42.8 42.9 43.3 43.3 42.6 【Male】 43.6 44 44 44.9 44.9 45.4 45.3 45 【Female】 36.2 37.1 37 38.3 38.3 39.1 39.3 38.6 Average length of employment (Years)
【Total】14.1 14.7 14.7 15.4 14.8 14.5 14.5 14 【Male】 15 15.8 15.7 16.4 15.3 14.6 14.6 14.3 【Female】 12 12.4 12.6 13.3 13.9 14.2 14.3 13.6 Number of new graduates recruited
*As of April each fiscal year
【Total】17 16 17 21 20 24 27 32 【Male】 11 10 11 14 16 15 18 18 【Female】 6 6 6 7 4 9 9 14 [Of which, female career-track employees】 1 1 2 1 1 1 4 5 Number of mid-career hires
*As of the end of each fiscal year
【Total】4 3 4 2 3 11 6 23 【Male】 3 3 4 2 3 10 5 14 【Female】 1 0 0 0 0 1 1 9 【Of which, female career-track employees】 0 0 0 0 0 0 1 7 Training hours (hours) - 1,642.5 1,526.0 2,778.0 4,715.0 15,151.0 16,404.5 17,079.5 Number of training participants - 171 134 216 756 843 1,513 1,835 Training Cost
(thousand yen)- 10,893 7,728 6,989 10,258 12,862 12,334 11,491 Attrition Rate(%)
【Overall】2.9 1.9 2.0 2.1 2.4 3 3.1 【Male】 2.5 1.8 2.2 2.3 2.7 3.7 3.7 【Female】 3.8 2.2 1.7 1.7 1.6 1.6 2.1 Ratio of managers(%)
【Overall】19.0 18.6 17.0 17.8 17.9 18.9 18.7 【Male】 97.3 96.3 95.8 96.0 93.9 94.3 95.2 【Female】 2.7 3.7 4.2 4.0 6.1 5.7 4.8 Consolidated Ratio of female managers(%) - - - - 13.3 16.5 17.4 17.7 Percentage of employees undergoing regular health check(%) 92.0 89.8 93.9 96.5 96.5 100 100 Rate of employees receiving advanced health screenings - - - - - - 23.9 89.3 Summary of health questionnaire results(Smoking Rates) - - 26.7 27.2 25.9 27.2 25.8 25.6 Summary of health questionnaire results(Percentage of individuals with regular exercise habits) - - 28.1 25.4 25.1 25.4 27.2 27.2 Summary of health questionnaire results(Percentage of individuals with a healthy body weight) - - 60.2 58.9 51.4 58.9 60.6 60.8 Percentage of employees taking stress check(%) 94.4 95.5 98.2 99.0 98.8 98.1 99.3 99.1 Results of stress check (ratio of people with high stress)(%) 10.8 7.8 5.9 7.9 8.0 8.0 8.7 8.7 Number of occupational accidents (number of cases) - - 0 2 2 2 2 1 Total number of occupational accidents - - -
00 0 0 0 Number of employees on leave due to injury or illness (persons) - - 3 3 3 6 4 7 Amount of investment relating to specific health management measures (thousand yen) - - - - - 13,390 27,250 16,758 Engagement survey
DI score※(%)- - - - - - - 57.4 Status of participation in initiatives for high-risk metric individuals - - - - - - - 89.3 Status of participation in initiatives related to women's health issues - - - - - - - 1 Presenteeism(%) - - - - - 94.4 94.5 94.6 Absenteeism - - - - - 1.46 0.36 0.72 *Specific measurement criteria for the engagement survey: In the engagement survey, we conduct an awareness survey on each employee on factors such as happiness
The DI value is measured by subtracting the negative responses from the positive responses to the items answered by employees. Number of people measured: 792;Healthy Work-life Balance(KAGA Electrocics Co.,Ltd.)2018/3 2019/3 2020/3 2021/3 2022/3 2023/3 2024/3 2025/3 Number of days of annual paid leave (Average for all employees, excluding carryover) 18.7 18.4 18.7 18.7 18.7 18.3 18.3 17.7 Ratio of taking paid leave(%) 56.8 57.9 63.1 53.2 54.3 56.2 70.1 68.5 Number of people utilizing childcare leave
【Total】19 17 23 17 22 19 26 29 【Female】 0 0 1 1 2 0 14 8 【Male】 0 0 22 16 20 19 12 21 Ratio of people returning to work after childcare leave(%) 86.6 100.0 92.9 100.0 100.0 100.0 93.8 100 Average monthly overtime (Hours) 9.7 11.3 11.9 12.7 10.0 14.6 13.3 12.3 Annual prescribed working hours (hours) 1,822.5 1,822.5 1,800.0 1,815.0 1,807.5 1,807.5 1,815.0 1,822.5 Total annual working hours
(Hours per person)- - - - 1,984 1,991 1,974 1,971 Salary(KAGA Electrocics Co.,Ltd.)2018/3 2019/3 2020/3 2021/3 2022/3 2023/3 2024/3 2025/3 Average annual salary
(thousand yen)7,567 7,646 7,504 7,815 7,804 8,890 8,901 8,523 Wage gap by gender
【all workers】- - - - - 66.2 66.6 68.7 【of which, regular workers】 - - - - - 65.6 66.0 67.2 【of which, part-time and fixed-term workers】 - - - - - 49.9 49.8 61.7 Governance
Corporate Governance2018/3 2019/3 2020/3 2021/3 2022/3 2023/3 2024/3 2025/3 Number of directors
【Total】10 10 10 10 11 11 6 6 6 【Male】 10 10 10 10 11 11 6 6 6 【Female】 0 0 0 0 0 0 0 0 0 Of which, the number of outside directors 2
(20.0%)3
(30.0%)3
(30.0%)4
(36.4%)4
(36.4%)3
(50.0%)3
(50.0%)3
(50.0%)Number of Audit & Supervisory Board Members (KANSAYAKU)
【Total】4 4 4 4 4 4 4 4 【Male】 4 4 4 4 4 3 3 3 【Female】 0 0 0 0 0 1 1 1 Attendance at Committee
【Nomination and Compensation Committee】
(Number of times held, Times)- - - - - - 6 6 (Attendance rate, %) - - - - - - 97.6 100 【Sustainability Committee】
(Number of times held, Times)- - - - - - 3 2 (Attendance rate, %) - - - - - - 100 100 Amount of remuneration for officers(million yen)
【Director】524 723 558 569 728 1,039 769 707 【Auditor】 47 46 46 46 46 46 38 36
- GRI Content Index
-
Our website refers to GRI Sustainability Reporting Standards.
General Disclosures
